Pictures can show us facts. 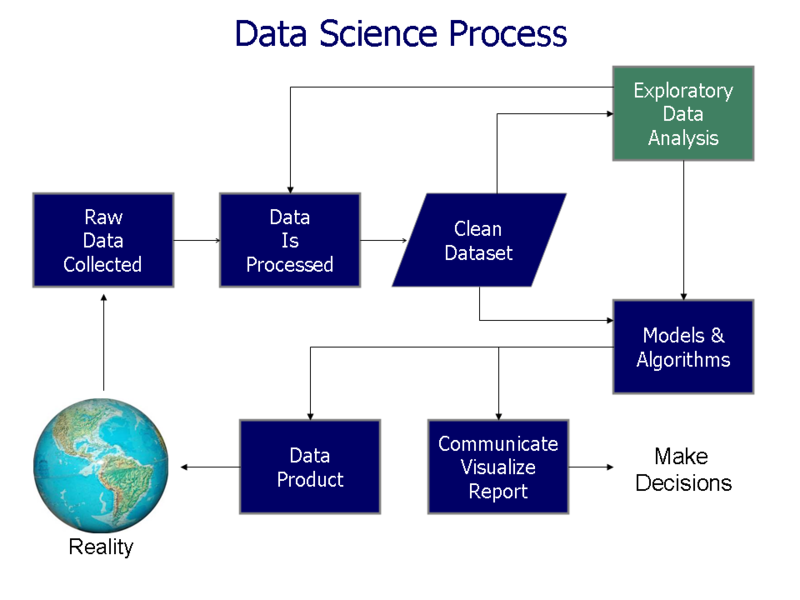

36 words
🖼️ Images & Media (32)

Anscombe's quartet 3.svg
Data visualization process v1.png
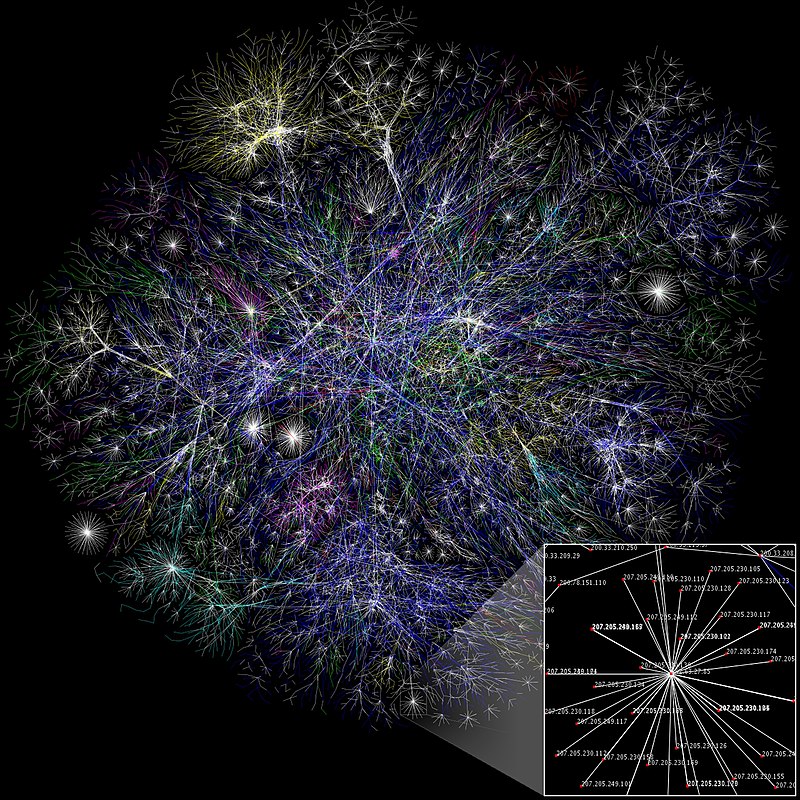
Internet map 1024.jpg
,_bubble_chart,_pie_chart_-_all_showing_same_data.svg/800px-20230606_Composite_of_bar_chart_(Sankey_diagram),_bubble_chart,_pie_chart_-_all_showing_same_data.svg.png)
20230606 Composite of bar chart (Sankey...
Grafana dashboard for MusicBrainz Hetzner...

Mouvement des planètes au cours du temps.png

Playfair TimeSeries.png

50 years of datavisulization berengueres...

ProductSpaceLocalization.png

Benin English.png
Tips-day-barchart.pdf

20210626 Variwide chart of greenhouse gas...
+ 20 more
More to explore
✨ What else?
Related topics you might enjoy
🪜 Step back
Simpler topics to build understanding
📚
Content adapted from Wikipedia
|
Readability: FK 15.7
|
Vital Level 4