We look at facts to learn things. 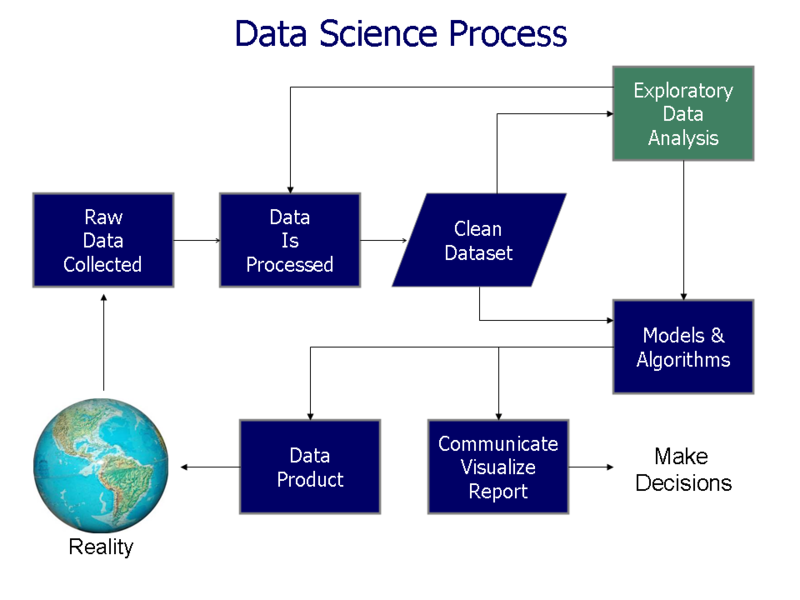
41 words
🖼️ Images & Media (7)
Data visualization process v1.png

Relationship of data, information and...

Social Network Analysis Visualization.png

Total Revenues and Outlays as Percent GDP 2013.png

U.S. Phillips Curve 2000 to 2013.png
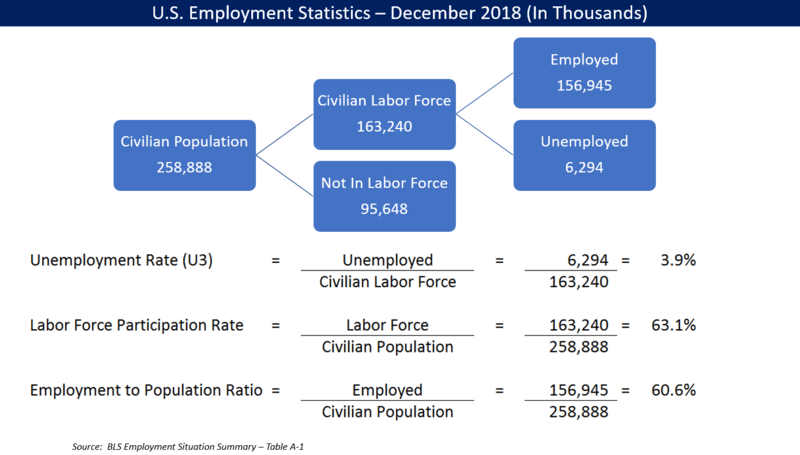
US_Employment_Statistics_-_March_2015.png

User-activities.png
More to explore
✨ What else?
Related topics you might enjoy
🔬 Go deeper
More advanced topics to explore
🪜 Step back
Simpler topics to build understanding
📚
Content adapted from Wikipedia
|
Readability: FK 14.0
|
Vital Level 5